
Housekeeping dashboard
Overview
Under Housekeeping -> Dashboard, you get an overview of tasks and their status in the camp.
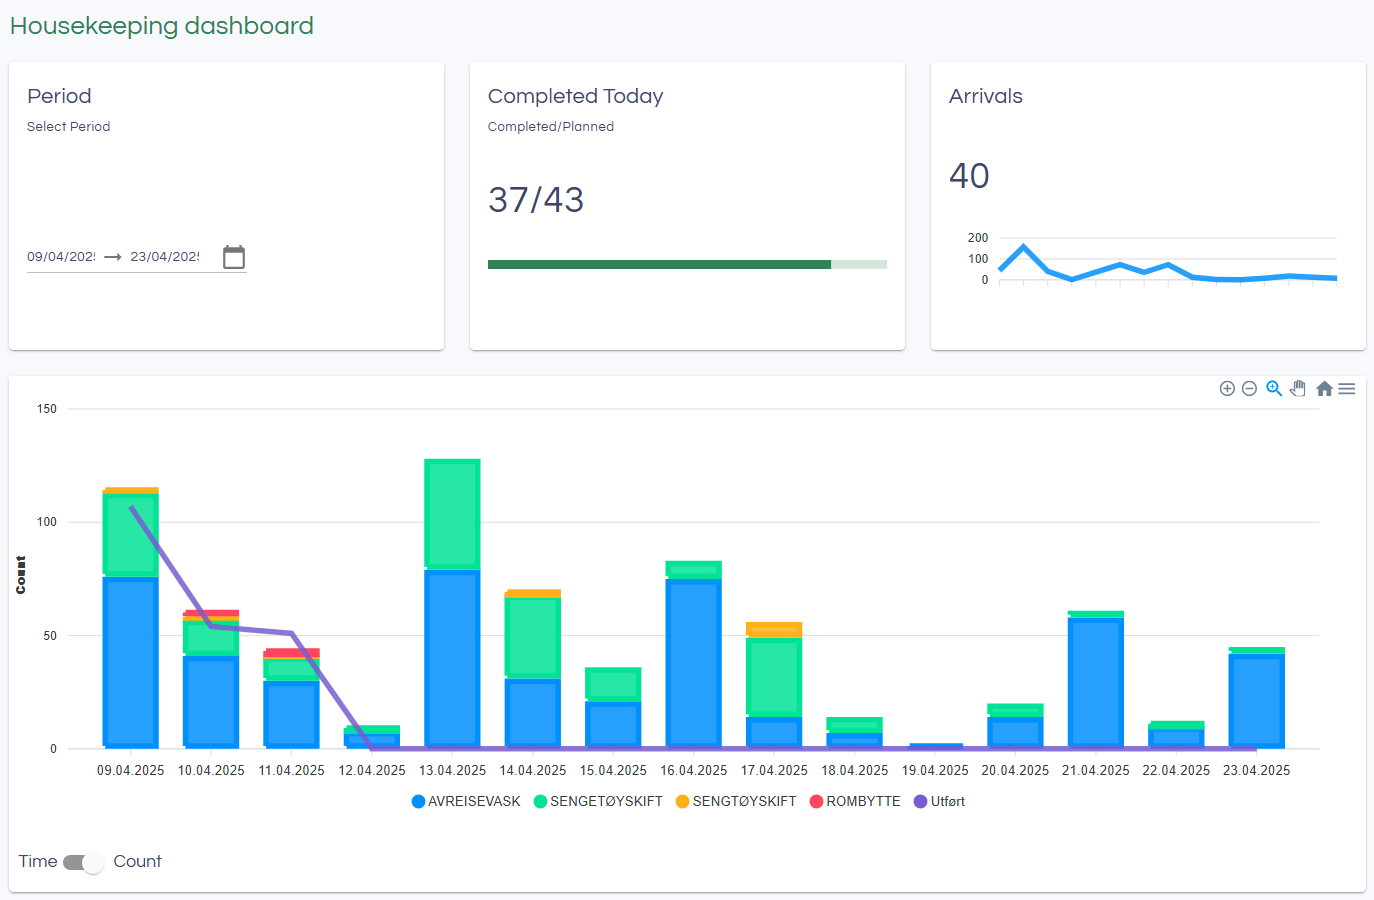
Period
When you enter the page, a 14-day period is selected starting from 2 days before today's date. You can choose a different time period if you prefer.
Completed Today
Shows the number of tasks completed and the number of tasks planned for today. The number of completed tasks can be higher than the number planned, for example, if there were tasks left over from yesterday that were completed today.
Arrivals
Displays a simple graph of expected arrivals during the selected period.
Graph
The bars in the graph show tasks by type, planned per day. The purple line shows the number of completed tasks per day.
Below the graph, you can choose between Time and Count. Read more about how this works in the next section.
Capacity and Time
You can set the expected time usage for a task. This is specified in minutes by clicking the Specify time for tasks button. A dialog will then appear like this:
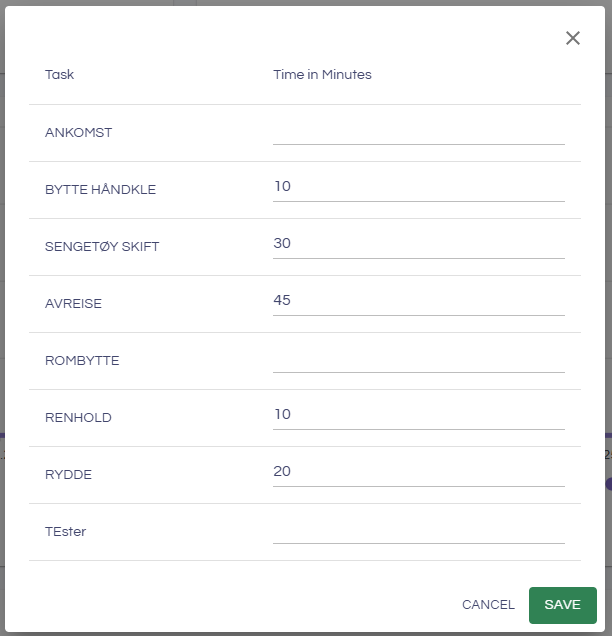
Register the expected time usage for each task in minutes and click Save. For each day, the planned time usage will now be calculated based on the tasks planned for that day.
You can also specify Capacity in the table at the bottom. Capacity is the number of available hours based on how many cleaners are scheduled to work. Once this is registered, the capacity will also be shown in the graph if you have selected Time below the graph. This is a planning tool to help organize the cleaning schedule.